This strategy is a trend-following trading strategy tailored for BTC/USDT pairs on the 1-hour timeframe. It focuses on identifying and riding significant market trends, minimizing risk, and maximizing profits by using technical indicators and clear decision-making frameworks.
Here’s an outline of the strategy:
Core Principles
- Follow the Trend: Only trade in the direction of a confirmed trend.
- Bullish Trend: When price consistently moves above key levels (e.g., MA50 > MA200) and indicators confirm upward momentum.
- Bearish Trend: When price consistently moves below key levels (e.g., MA50 < MA200) with downward momentum.
- Avoid Ranging Markets: Wait for clear breakouts or trend confirmations to avoid false signals.
- Risk Management:
- Use stop-loss orders to protect against losses.
- Identify and respect key support and resistance levels for entries and exits.
Bullish Trend example
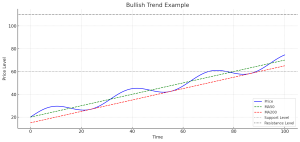
Bullish Trend (First Diagram)
- Price Movement: The price consistently moves upward, staying above key moving averages (MA50 and MA200).
- Indicators:
- The MA50 (green dashed line) is above the MA200 (red dashed line), confirming an upward trend.
- Price forms higher highs and higher lows, staying above key support levels (gray line at 60).
- Key Levels:
- Support Level: Price tends to bounce back when nearing the support level.
- Resistance Level: Price approaches and potentially breaks resistance, indicating strength.
Bearish Trend Example
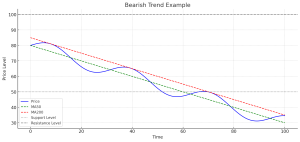
Bearish Trend (Second Diagram)
- Price Movement: The price consistently moves downward, staying below the key moving averages (MA50 and MA200).
- Indicators:
- The MA50 is below the MA200, confirming a downtrend.
- Price forms lower highs and lower lows, moving away from resistance levels (black line at 100).
- Key Levels:
- Resistance Level: Acts as a ceiling where price retraces during rallies.
- Support Level: Price may briefly bounce but continues downward momentum.
Key Takeaways:
- Bullish Trends: Look for upward price movements above both MA50 and MA200. Wait for price pullbacks to enter near support levels.
- Bearish Trends: Look for downward price movements below both MA50 and MA200. Avoid buying until a trend reversal is clear.
- Avoid Ranging Markets: When MA50 and MA200 lines are close together and price fluctuates without direction, wait for a breakout.
Application:
- Risk Management: Use stop-loss orders just below support levels in bullish trends or above resistance in bearish trends to minimize losses.
- Trade Entries:
- Enter trades when price confirms trends near moving averages and key levels.
- Avoid trades in uncertain or ranging market conditions.
Key Indicators Used
- Moving Averages (MA50 & MA200):
- MA50 crossing above MA200 = bullish crossover.
- MA50 crossing below MA200 = bearish crossover.
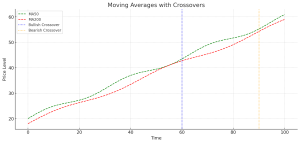
Moving Averages (MA50 & MA200): Moving Averages (MA50 & MA200)
- Bullish Crossover: When the MA50 (green line) crosses above the MA200 (red line), it signals a bullish trend. This is marked near time 60.
- Bearish Crossover: When the MA50 crosses below the MA200, it signals a bearish trend. This is marked near time 90.
- Average Directional Index (ADX):
- ADX > 25: Strong trend.
- ADX < 20: Weak or ranging market.
-
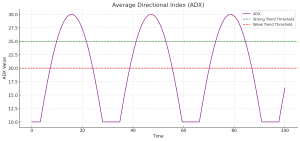
Average Directional Index (ADX) Average Directional Index (ADX)
- ADX > 25: Indicates a strong trend. The trend can be bullish or bearish, depending on other indicators.
- ADX < 20: Indicates a weak or ranging market. Avoid trading during such periods.
- Relative Strength Index (RSI):
- RSI > 50: Momentum favors buyers (bullish).
- RSI < 50: Momentum favors sellers (bearish).
- Overbought (>70) and oversold (<30) levels indicate potential reversals.
-
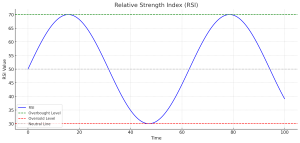
Relative Strength Index (RSI) Relative Strength Index (RSI)
- Overbought (>70): Indicates potential reversal or price correction from upward momentum.
- Oversold (<30): Indicates potential reversal or price recovery from downward momentum.
- RSI > 50: Momentum favors buyers (bullish).
- RSI < 50: Momentum favors sellers (bearish).
- MACD (Moving Average Convergence Divergence):
- Positive crossover (MACD line > Signal line): Bullish momentum.
- Negative crossover (MACD line < Signal line): Bearish momentum.
-
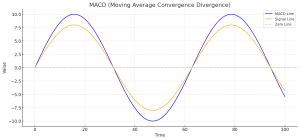
MACD (Moving Average Convergence Divergence) MACD (Moving Average Convergence Divergence)
- Positive Crossover: The MACD line (blue) crossing above the Signal line (orange) indicates bullish momentum.
- Negative Crossover: The MACD line crossing below the Signal line indicates bearish momentum.
- Zero Line: Acts as a reference point for momentum direction.
- Parabolic SAR:
- Dots below the price = bullish trend.
- Dots above the price = bearish trend.
- Dots Below the Price: Indicates a bullish trend, where prices are expected to rise.
- Dots Above the Price: Indicates a bearish trend, where prices are expected to fall.
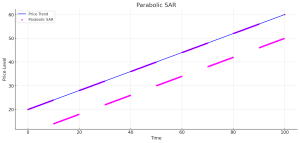
Parabolic SAR Parabolic SAR
- Dots Below the Price: Indicates a bullish trend, where prices are expected to rise.
- Dots Above the Price: Indicates a bearish trend, where prices are expected to fall.
Summary:
These indicators are tools to confirm trends and reversals:
- Use Moving Averages for identifying crossovers.
- Use ADX to measure trend strength.
- Monitor RSI for momentum and reversal signals.
- Use MACD to confirm bullish or bearish momentum.
- Use Parabolic SAR for trend direction and potential stop-loss placement.
- Volume:
- Volume spikes confirm the strength of breakouts or trends.
Process for New Positions
- Analyze Trend:
- Check MA crossovers and ADX for trend direction and strength.
- Confirm with RSI, MACD, and Parabolic SAR.
- Identify Entry Points:
- Breakouts above resistance or below support.
- Trend continuation signals (e.g., price bouncing off moving averages in a strong trend).
- Set Stop-Loss and Take-Profit:
- Place stop-loss below support for long positions or above resistance for short positions.
- Set multiple take-profit levels to scale out gains.
- Wait for Confirmation:
- Avoid impulsive entries. Wait for multiple indicators to align.

